|
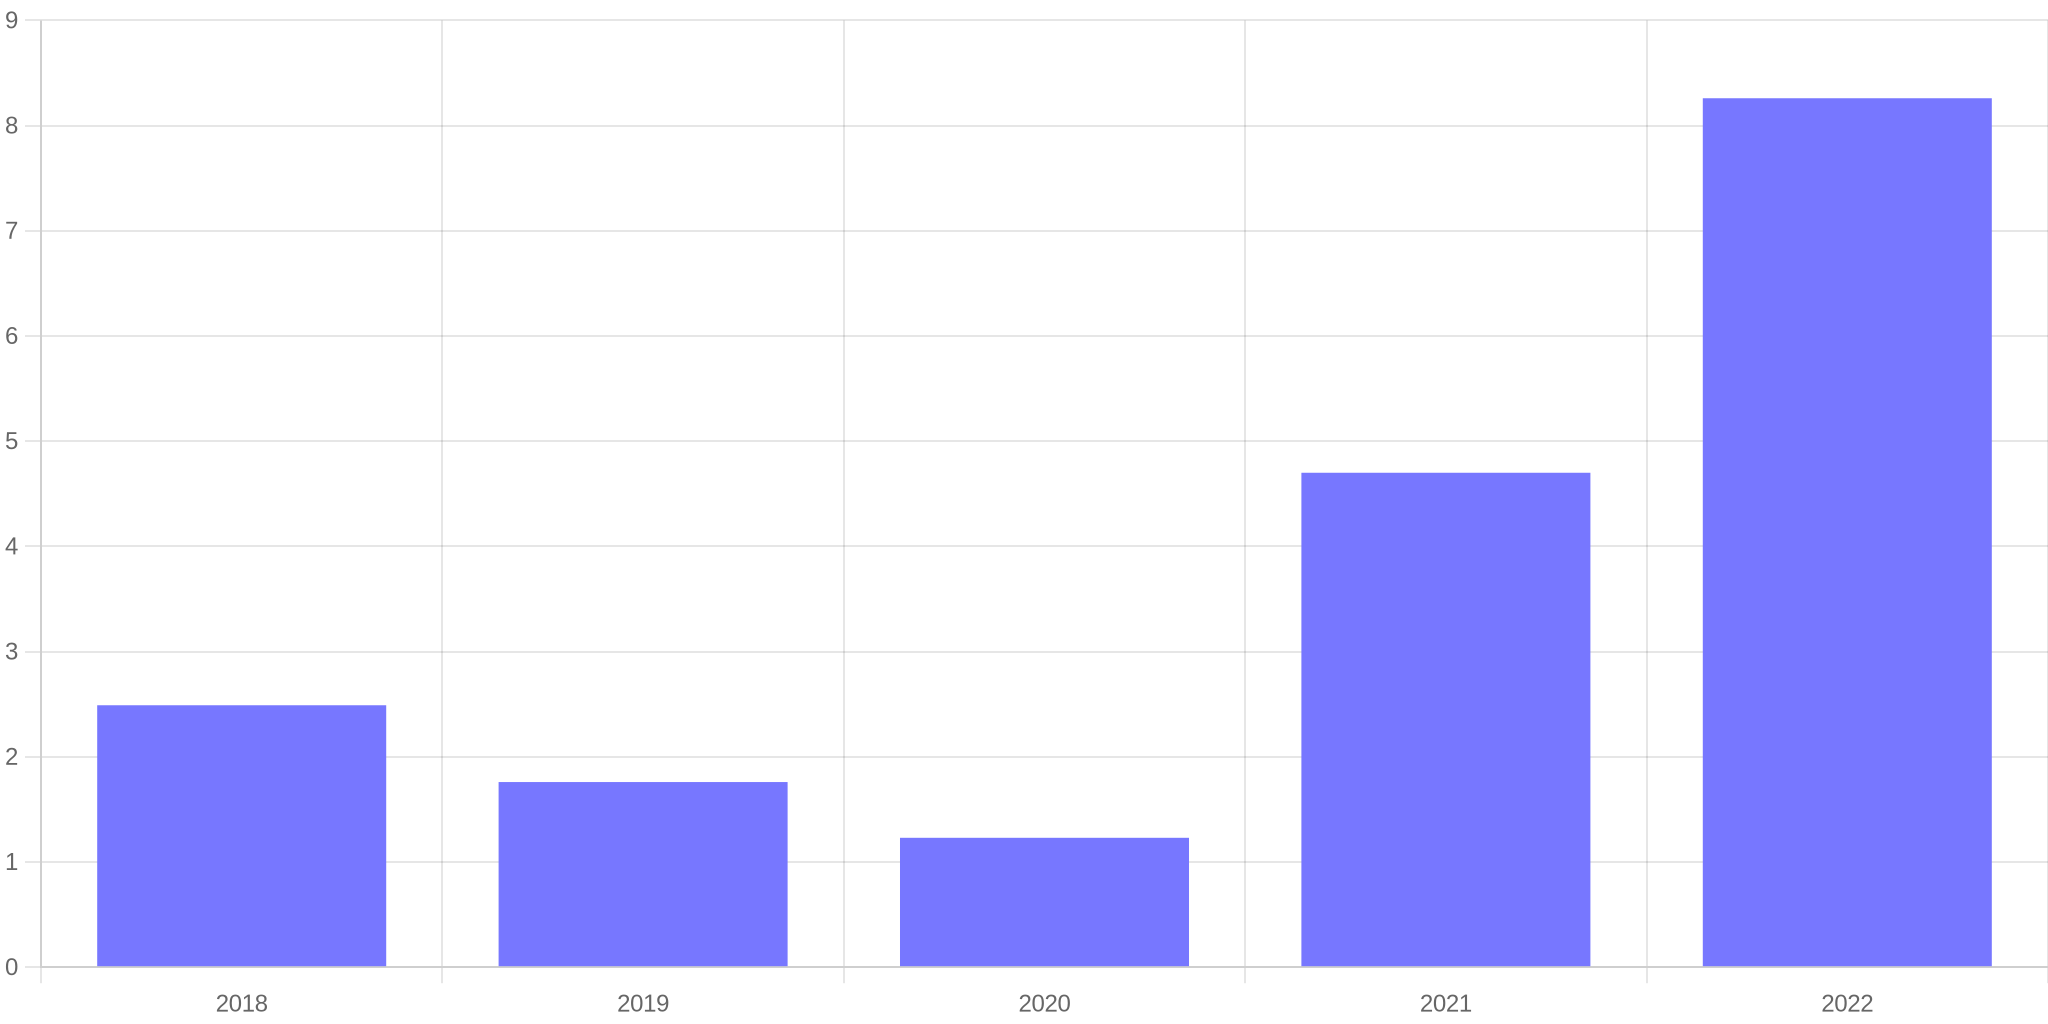
US Inflation Rate from 2021 to 2022 |
|
|
Average inflation rate |
8.26% |
|
Converted amount ($1 base) |
$1.07 |
|
Price difference ($1 base) |
$0.07 |
|
CPI in 2021 |
270.970 |
|
CPI in 2022 |
289.109 |
|
Inflation in 2021 |
4.70% |
|
Inflation in 2022 |
8.26% |
|
$1 in 2021 |
$1.07 in 2022 |
Know What Is the Current US Inflation Rate?
US Inflation Rate in 2022
and its effect on dollar value
$1 in 2021 is equivalent in purchasing
power to about $1.07 today. The dollar had an
average inflation rate of 8.26% in the last 12
months. As a result, the real value of a dollar has been decreasing recently.
Purchasing power decreased by 8.26% in 2022
compared to 2021. On average, you would have to spend 8.26% more money in 2022
than in 2021 for the same item.
This means that today's prices are
1.07 times higher than average prices since 2021, according to the Bureau of
Labor Statistics consumer price index. A dollar today only buys 93.458% of what
it could buy back then.
The US inflation rate in 2021 was 4.70%.
The current US inflation rate 2022
compared to last year is now 8.26%. If this number
holds, $1 today will be equivalent in buying power to $1.08 next year. The current
US inflation rate 2022 page gives
more detail on the latest inflation rates.
US
Inflation rate 2022
is calculated by change in the consumer price index (CPI). The CPI in 2022 is 289.11. It was 270.97 in the previous year, 2021. The
difference in CPI between the years is used by the Bureau of Labor Statistics
to officially determine inflation.
Recent USD inflation
Annual Rate, the Bureau of Labor Statistics CPI
US Inflation rate by City
US Inflation
rate can vary widely by city, even within the United States. Here's how some
cities fared in 2021 to 2022 (figures shown are purchasing power equivalents of
$1):
Atlanta, Georgia: 7.09% average rate, $1 → $1.07,
cumulative change of 7.09%
Miami-Fort Lauderdale, Florida: 6.47% average rate, $1 → $1.06,
cumulative change of 6.47%
Dallas-Fort Worth, Texas: 5.20% average rate, $1 → $1.05,
cumulative change of 5.20%
Seattle, Washington: 5.18% average rate, $1 → $1.05,
cumulative change of 5.18%
Houston, Texas: 5.15% average rate, $1 → $1.05,
cumulative change of 5.15%
Detroit, Michigan: 4.90% average rate, $1 → $1.05,
cumulative change of 4.90%
Philadelphia, Pennsylvania: 4.84% average rate, $1 → $1.05,
cumulative change of 4.84%
Chicago, Illinois: 4.81% average rate, $1 → $1.05,
cumulative change of 4.81%
Boston, Massachusetts: 4.66% average rate, $1 → $1.05,
cumulative change of 4.66%
New York: 3.84% average rate, $1 → $1.04,
cumulative change of 3.84%
San Francisco, California: 3.47% average rate, $1 → $1.03,
cumulative change of 3.47%
Denver, Colorado: 0.00% average rate, $1 → $1.00,
cumulative change of 0.00%
Minneapolis-St Paul, Minnesota: 0.00% average rate, $1 → $1.00,
cumulative change of 0.00%
San Diego, California: 0.00% average rate, $1 → $1.00,
cumulative change of 0.00%
Tampa, Florida: 0.00% average rate, $1 → $1.00,
cumulative change of 0.00%
St Louis, Missouri: 0.00% average rate, $1 → $1.00,
cumulative change of 0.00%
Phoenix, Arizona: 0.00% average rate, $1 → $1.00,
cumulative change of 0.00%
Atlanta, Georgia experienced the highest rate of
inflation during the 1 years between 2021 and 2022 (7.09%).
Phoenix, Arizona experienced the lowest rate of
inflation during the 1 years between 2021 and 2022 (0.00%).
Note
that some locations showing 0% inflation may have not yet reported latest data.
How to calculate US
inflation rate for $1 since 2021
Our calculations use the following
inflation rate formula to calculate the change in value between 2021 and today:
Then plug in historical CPI values.
The U.S. CPI was 270.97016666667 in the year 2021 and 289.109 in 2022:
$1 in 2021 has the same
"purchasing power" or "buying power" as $1.07 in 2022.
To get the total inflation rate for
the 1 years between 2021 and 2022, we use the following formula:
Plugging in the values to this equation, we get:
Alternate Measurements of US Inflation Rate
The above data describe the CPI for
all items. Also of note is the Core
CPI, which measures inflation for all items except for the more
volatile categories of food and energy. Core inflation averaged 4.07% per year
between 2021 and 2022 (vs all-CPI inflation of 8.26%), for an inflation total
of 4.07%.
When using the core inflation
measurement, $1 in 2021 is equivalent in buying power to $1.04
in 2022, a difference of $0.04. Recall that for All Items, the converted amount
is $1.07 with a difference of $0.07.
In 2021, core inflation was 3.57%.
Chained CPI is an alternative measurement that
takes into account how consumers adjust spending for similar items. Chained
inflation averaged 5.02% per year between 2021 and 2022, a total inflation
amount of 5.02%.
According to the Chained CPI
measurement, $1 in 2021 is equal in buying power to $1.05
in 2022, a difference of $0.05 (versus a converted amount of $1.07/change of
$0.07 for All Items).
In 2021, chained inflation was 4.48%.
Read also


0 Comments